Overview
A real-time dashboard is a dashboard that contains charts that are automatically updated with the most current data available. The typical use case is to load a chart with some historical data first and then live update it as new data comes in. In this tutorial, you will learn how to build such real-time dashboards with only open-source tools and without any third-party services.
The main challenge of building such a dashboard is to design a proper architecture to react to changes in data all the way up from the database to the charts on the frontend. The part from the server to the frontend is a simple one, since we have a lot of technologies and frameworks built to handle real-time data updates. Going from database to server is much trickier. The underlying problem is that most of the databases, which are good for analytic workload, don't provide out-of-the-box ways to subscribe to changes in the data. Instead, they are designed to be polled.
Cube, which acts as a middleman between your database and analytics dashboard, can provide a real-time WebSockets-based API for the frontend, while polling the database for changes in data.
You can check out the demo of real-time dashboard built with Cube here.

On the frontend, Cube provides an API to load initial historical data and subscribe to all subsequent updates.
In our tutorial, we are going to use React as a frontend framework. Cube has a @cubejs-client/react package, which provides React components for easy integration of Cube into the React app. It uses React hooks to load queries and subscribes for changes.
In this tutorial, I'll show you how to build a real-time dashboard either with MongoDB or BigQuery. The same approach could be used for any databases that Cube supports.
Update from April 2023. This guide was authored more than 3 years ago and certain parts (e.g., generation of the front-end boilerplate code) are not relevant anymore. Please see up-to-date front-end guides in the blog.
Cube API with MongoDB
Feel free to jump to the next part if you want to use BigQuery instead of MongoDB
For quite a long time, doing analytics with MongoDB required additional overhead compared to modern SQL RDBMS and Data Warehouses associated with aggregation pipeline and MapReduce practices. To fill this gap, MongoDB released the MongoDB connector for BI, which acts as a MySQL server on top of your MongoDB data. Under the hood, it bridges existing aggregation mechanisms to the MySQL protocol, allowing standard MySQL clients to connect and issue SQL queries.
Setting up MongoDB and BI Connector
If you don’t have a MongoDB instance, you can download it here. The BI Connector can be downloaded here. Please make sure you use the MongoDB version that supports the MongoDB connector for BI.
After the BI connector has been installed, please start a mongod instance first. If you use the downloaded installation, it can be started from its home directory like so:
The BI connector itself can be started the same way:
Please note that mongosqld resides in another bin directory. If everything works correctly, you should see a success log message in your shell for the mongosqld process:
If you’re using the MongoDB Atlas, you can use this guide to enable BI connector.
Getting a Sample Dataset
You can skip this step if you already have data for your dashboard.
We host a sample events collection, which you can use for a demo dashboard. Use the following commands to download and import it.
Please make sure to restart the MongoDB BI connector instance in order to generate an up-to-date MySQL schema from the just added collection.
Creating Cube Application
We are going to use Cube CLI to create our new Cube application with the MongoBI driver:
Go to the just created real-time-dashboard folder and update the .env file with your
MongoDB credentials.
Now let's start a Cube development server.
This starts a development server with a playground. We'll use it to generate Cube schema, test our data and, finally, build a dashboard. Open http://localhost:4000 in your browser.
Cube uses the data schema to generate an SQL code, which will be executed in your database. Data schema is a JavaScript code, which defines measures and dimensions and how they map to SQL queries.
Cube can generate a simple data schema based on the database’s tables. Select the events table and click “Generate Schema.”
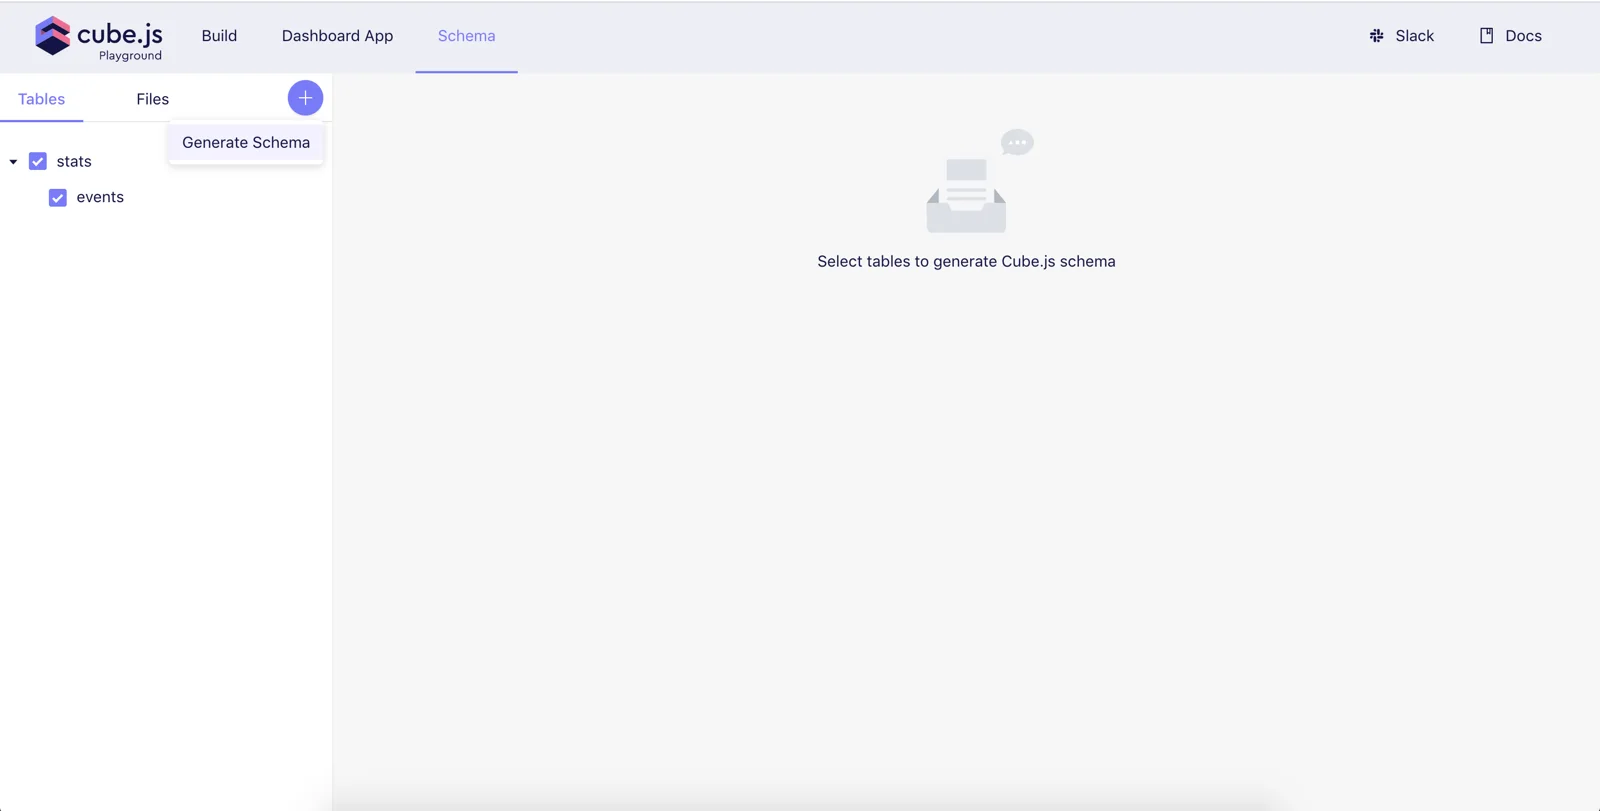
Once the schema is generated, we can navigate to the “Build” tab and select some measures and dimensions to test out the schema. The "Build" tab is a place where you can build sample charts with different visualization libraries and inspect how that chart was created, starting from the generated SQL all the way up to the JavaScript code to render the chart. You can also inspect the JSON query, which is sent to the Cube backend.
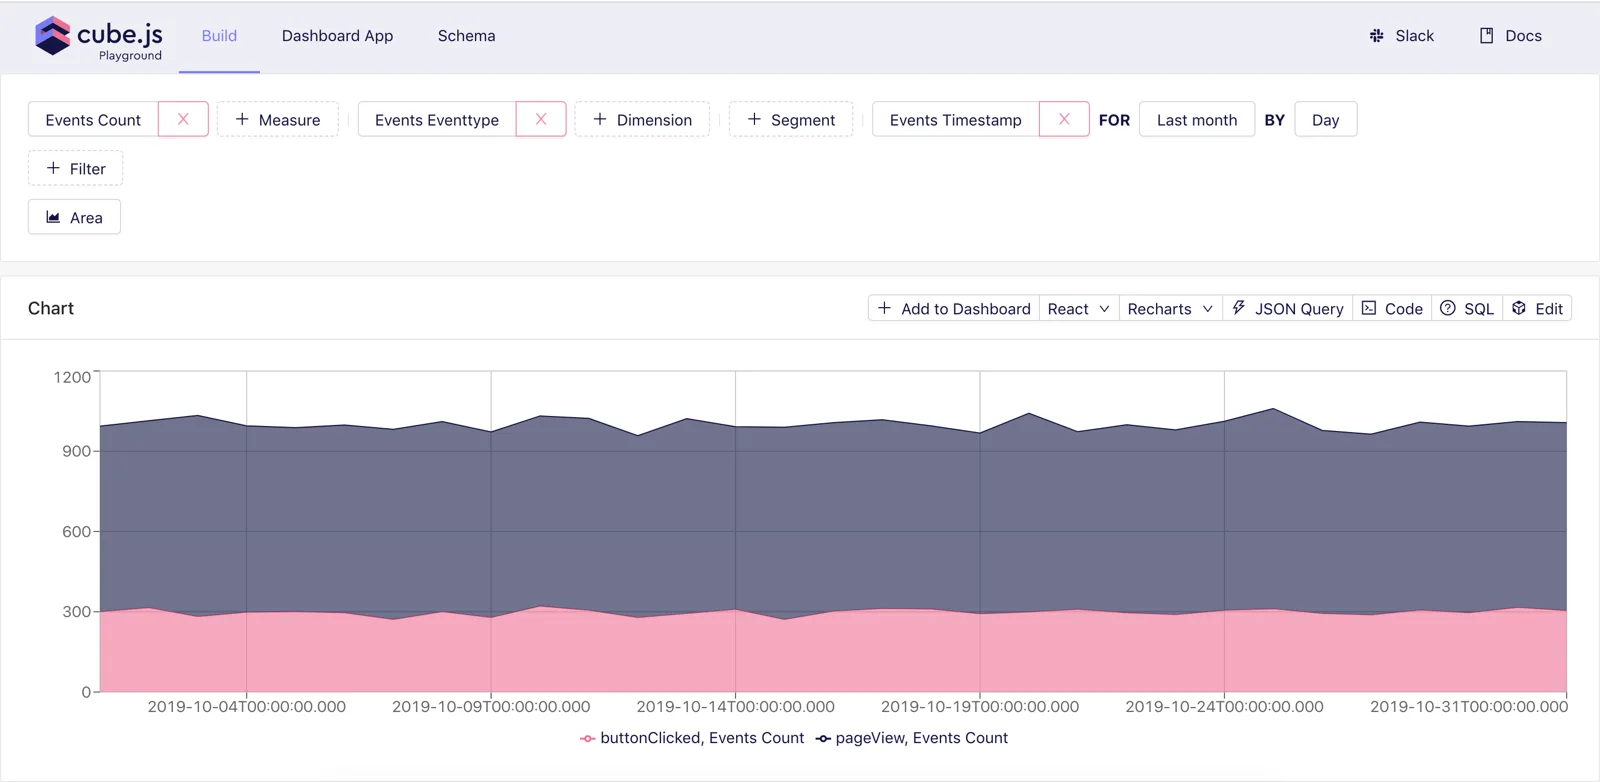
Although auto-generated schema is a good way to get started, in many cases you'd need to add more complex logic into your Cube schema. You can learn more about data schema and its features here. In our case, we want to create several advanced measures and dimensions for our real-time dashboard.
Replace the content of schema/Events.js with the following.
First, we define measures for our dashboard. The count measure is just a simple count
of all total events; pageView and buttonClick are counts of corresponding
events. The online measure is a bit more complex. It returns the number of unique
users who performed any event in the last 3 minutes.
Within dimensions we have simple anonymousId, eventType, and timestamp,
which just shows the values from corresponding columns. We've also defined a
secondsAgo dimension, which calculates the number of seconds since the event's
occurrence.
Lastly, we are setting a custom
refreshKey. It controls
the refresh of the Cube in-memory cache layer. Setting it to SELECT UNIX_TIMESTAMP() will refresh the cache every second. You need to carefully
select the best refresh strategy depending on your data to get the freshest
data when you need it, but, at the same time, not overwhelm the database with a lot of unnecessary queries.
We will use these measures and dimensions in the next part, when we create a frontend dashboard app with React and Chart.js.
Cube API with BigQuery
Google BigQuery is a serverless and highly scalable data warehouse. It is designed to quickly process complex queries on large datasets. It uses SQL as a query language, which makes it easy to get started.
There are a few things worth mentioning before we proceed. BigQuery isn't designed
for transactional queries like CRUD operations. It takes around 2 seconds to run a simple query like SELECT * FROM bigquery-public-data.object LIMIT 10 on a 100 KB table with 500 rows. Also, BigQuery is slower on small datasets than traditional relational databases, such as MySQL or Postgres.
BigQuery is a paid service, where customers are charged based on query and storage costs. Real-time data streaming is a paid feature as well; you can check its pricing here. There are best practices on how to control the amount of processed data per query in order to reduce the cost. We'll talk about them later in this part.
Prerequisites
You are going to need a Google Cloud Platform (GCP) account in order to use BigQuery. If you don't have it yet, please refer to this guide to set it up and then come back here to continue our tutorial.
Once you have a GCP project with billing enabled (by starting a free trial or using a coupon, for example), you can move on to the next steps.
As a dataset, we'll use a sample public events dataset—cubejs-examples.stats.events. Feel free to use your own dataset if you have one.
Creating a Cube Application
We are going to use Cube CLI to create our new Cube application with the BigQuery driver:
Now, we need to configure credentials to access BigQuery. Cube uses
environment variables to manage database credentials. To connect to BigQuery, we need to set two variables: CUBEJS_DB_BQ_PROJECT_ID and CUBEJS_DB_BQ_KEY_FILE.
The first one is simply your project ID, which you can copy from the lift of
your projects. The CUBEJS_DB_BQ_KEY_FILE variable should point to the Service
Account Key
File. To get this file, you need to create a new service account on IAM -> Service accounts page. Add BigQuery Data Viewer and BigQuery Job User roles to this service account and then generate a new key file. Download it and place it into the real-time-dashboard folder.
Your real-time-dashboard/.env file should look like the following.
Data Schema
Cube uses the data schema to generate an SQL code, which will be executed in your database. Data schema is a JavaScript code, which defines measures and dimensions and how they map to SQL queries. You can learn more about data schema and its features here.
As mentioned before, we are going to use data from a public BigQuery table—cubejs-examples.stats.events. Inside the project folder, create the schema/Events.js file with the following content.
The sql property of the cube defines the SQL that will be used to generate a
table that will be queried by a cube. It usually takes the form of a SELECT * FROM table query. In our case, you can see we are using
FILTER_PARAMS
here. Usually you don't need to pass filters to the sql property and filtering
is done automatically by Cube, but in the case of BigQuery partitioned
tables, you need to
do that. The events table is partitioned by a timestamp and cannot be queried
without a filter over the timestamp column. BigQuery partitioned tables is an excellent way to reduce the cost and improve the performance of our queries.
Next, we define measures for our dashboard. The count measure is just a simple count
of all total events; pageView and buttonClick are counts of corresponding
events. The online measure is a bit more complex. It returns the number of unique
users who performed any event in the last 3 minutes.
Within dimensions we have the simple anonymousId, eventType, and timestamp,
which just shows the values from corresponding columns. We've also defined a
secondsAgo dimension, which calculates the number of seconds since the event's
occurrence.
Lastly, we are setting a custom refreshKey. It controls the refresh of the Cube in-memory cache layer. We're making it to count the number of rows in our table. This way Cube will not issue unnecessary queries against BigQuery, which would help to keep our billing low.
Feel free to play around with measures and dimensions in the playground. Please make sure you always select some date range, since it is required because of the partitioning.
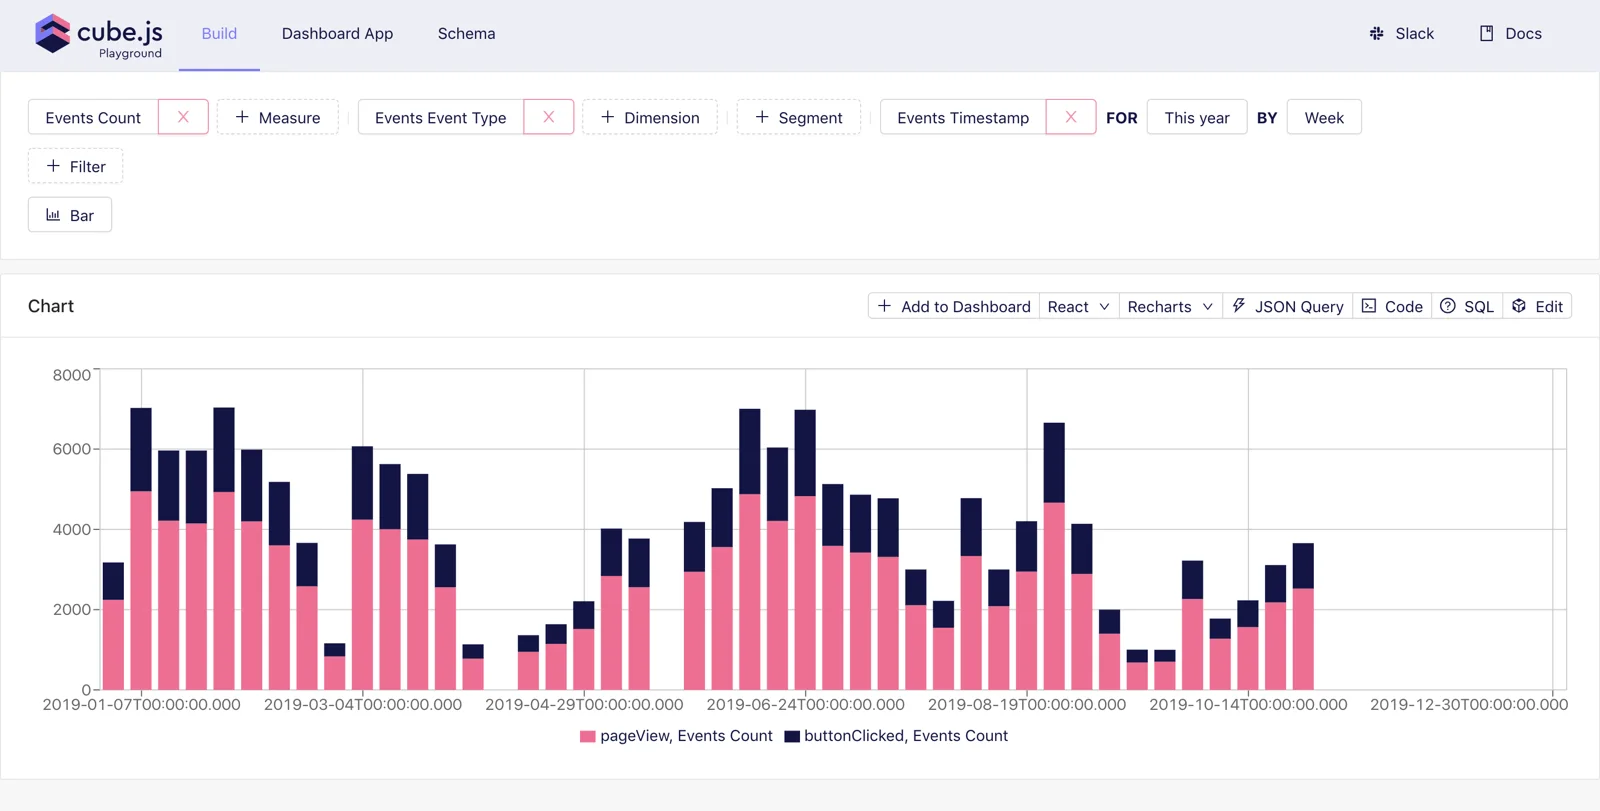
We will use these measures and dimensions in the next part, when we create a frontend dashboard app with React and Chart.js.
Frontend Dashboard
In the previous part we've successfully configured a database, BigQuery or MongoDB, and created a Cube schema for the real-time dashboard. Now it is time to build a dashboard itself!
Cube Playground can generate a boilerplate frontend app. It is a convenient way to start developing a dashboard or analytics application. You can select your favorite frontend framework and charting library and Playground will generate a new application and wire all things together to work with the Cube API.
We'll use React and Chart.js in our tutorial. To generate a new application, navigate to "Dashboard App,” select "React Antd Static" with "Chart.js", turn on the "Web Socket Transport (Real-time)" switch, and click on the “Create dashboard app” button.
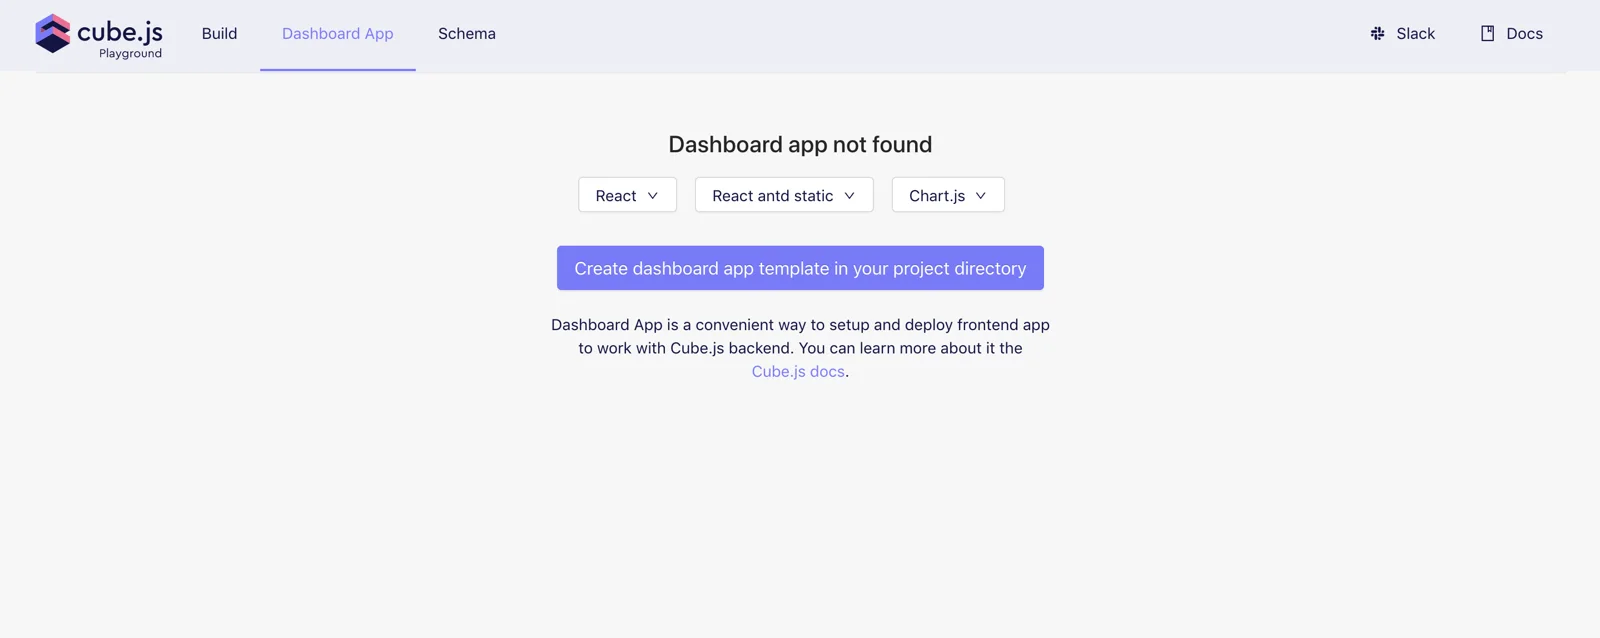
It could take a while to generate an app and install all the dependencies. Once it is done, you will have a dashboard-app folder inside your Cube project folder. To start a dashboard app, either go to the “Dashboard App” tab in the playground and hit the “Start” button, or run the following command inside the dashboard-app folder:
Make sure the Cube backend process is up and running since our dashboard uses its API. The frontend application is running on http://localhost:3000.
To add a chart on the dashboard, you can either edit the dashboard-app/src/pages/DashboardPage.js file or use Cube Playground. To add a chart via Playground, navigate to the "Build" tab, build a chart you want, and click the "Add to Dashboard" button.
Configure Cube for Real-Time Data Fetch
We need to do a few things for real-time support in Cube. First,
WebSockets transport should be enabled by setting the CUBEJS_WEB_SOCKETS environment variable to true.
Check that the following line is present in the .env file:
Next, we need to update the cube.js file to pass a few additional options to the
Cube server.
Update the content of the cube.js file the following.
We have passed two configuration options to Cube. The first,
processSubscriptionsInterval, controls the polling interval. The default value
is 5 seconds; we are setting it to 1 second to make it slightly more real-time.
The second, refreshKeyRenewalThreshold, controls how often the refreshKey is
executed. The default value of this option is 120, which is 2 minutes. In the previous part, we've changed refreshKey to reset a cache every second, so it doesn't make sense for us to wait an additional 120 seconds to
invalidate the refreshKey result itself, that’s why we are changing it to 1 second
as well.
These are all the updates we need to make on the backend part. Now, let's update the
code of our dashboard app. First, let's check that the @cubejs-client/ws-transport
package is installed in the package.json file in the dashboard-app folder. It provides a WebSocket transport to work with the Cube real-time API:
Now, we need to update how we request a query itself in the src/components/ChartRenderer.js. Make the following changes:
That's it! Now you can add more charts to your dashboard, perform changes in the database, and see how charts are updating in real time.
You can also check this online live demo with various charts displaying real-time data.
In the next part, we'll talk about how to deploy our application, both the backend and the frontend.
Deployment
Now, let's deploy our Cube API and the dashboard application. In this tutorial, we'll deploy both the Cube API and the dashboard application to Heroku.
Cube API Deployment
There are multiple ways you can deploy a Cube API; you can learn more about them here in the docs.
The tutorial assumes that you have a free Heroku account. You'd also need a Heroku CLI; you can learn how to install it here.
First, let's create a new Heroku app. Run the following command inside your Cube project folder.
We also need to provide credentials to access the database. I assume you have your database already deployed and externally accessible. The example below shows setting up credentials for MongoDB.
Then, we need to create two files for Docker. The first file, Dockerfile, describes how to build a Docker image. Add these contents:
The second file, .dockerignore, provides a list of files to be excluded from the image. Add these patterns:
Now we need to build the image, push it to the Heroku Container Registry, and release it to our app:
Let's also provision a free Redis server provided by Heroku:
Great! You can run the heroku open --app real-time-dashboard-api command to open your Cube API and see this message in your browser:
Dashboard App Deployment
The dashboard app should be deployed as a static website.
To do so on Heroku, we need to create the second Heroku app. Run the following command inside the dashboard-app folder:
Then, enable the static website build pack:
Next, we need to create the static.json file under the dashboard-app folder with the following contents:
Also, we need to set Cube API URL to the newly created Heroku app URL. In the src/App.js file, change this line:
Finally, we need to run the npm run build command
and make sure the build folder is tracked by Git. By default, .gitignore
excludes that folder, so you need to remove it from .gitignore.
Once done, commit your changes and push to Heroku. 🚀
That's it! You can run the heroku open command to open your dashboard application in your browser and see it working with Cube.
Congratulations on completing this guide! 🎉
I’d love to hear from you about your experience following this guide. Please send any comments or feedback you might have in this Slack Community. Thank you and I hope you found this guide helpful!
